TOPCAT
Here's an example for plotting the 50 most massive halos (at redshift 0) from three halo catalogues of the BolshoiP simulation, using Topcat's version 4.1:
Write following query into CosmoSim's Query interface:
SELECT * FROM bolshoip.bdmv WHERE snapnum=214 ORDER BY mvir DESC LIMIT 50
and submit it to the Short Queue by pressing the "Submit new SQL Query" button.
Once the query is finished, navigate to the "Results table" tab. You should see a list of the 50 most massive halos from the BDMV-catalogue of the BolshoiP simulation, sorted by mass mvir column).
Leave the web browser open and start Topcat. For Linux:
java -jar topcat-full.jar
Consult Topcat's documentation for more details.
In Topcat, your table now appears in the "Table List". Click on the cube-icon ![]() for 3D plots. A new Cube Plot window opens.
In the "Position" tab (default) choose your table from the "Table" drop-down menu and choose following axes:
for 3D plots. A new Cube Plot window opens.
In the "Position" tab (default) choose your table from the "Table" drop-down menu and choose following axes:
- X: BolshoiP__BDMV__x
- Y: BolshoiP__BDMV__y
- Z: BolshoiP__BDMV__z
You can see now the 3D distribution of the most massive BDMV-halos in the cosmological box!
only for Topcat version 4.1 and above:
To make things more interesting, click on the Form tab and choose the Add size mark icon. At Coordinates - Size: choose the bolshoip__bdmv__mvir-column.
Now small spheres are drawn with their radius indicating the mass of each halo! Enhance the plot by choosing Shading Mode transparent instead of flat. Now the centers of each halo are visible again and overlapping halos can be identified more easily.
Query the database to get the 50 most massive halos from the BDMW and FOF catalogues as well:
SELECT * FROM bolshoip.bdmv WHERE snapnum=214 ORDER BY mvir DESC LIMIT 50

SELECT * FROM bolshoip.fof WHERE snapnum=214 ORDER BY mass DESC LIMIT 50
(Replace mvir by mass for FOF catalogues.)
Send these tables also to Topcat.
In Topcat's 3D plot window, click on the icon with many blue and red dots and a green plus ![]() ("Add a new positional plot control to the stack").
("Add a new positional plot control to the stack").
Choose the BDMW-table, adjust x,y,z coordinates and size as before. Repeat for the FOF-table (but use "mass" for the "Size" of spheres).
Make the shading types for these two data sets also transparent. Your plot should now look similar to the one below. It is nicely visible that most of these halos are found in each of the three halo catalogues. BDMW halos are generally a little bit smaller, since these halos are cut-off at a higher density threshold.
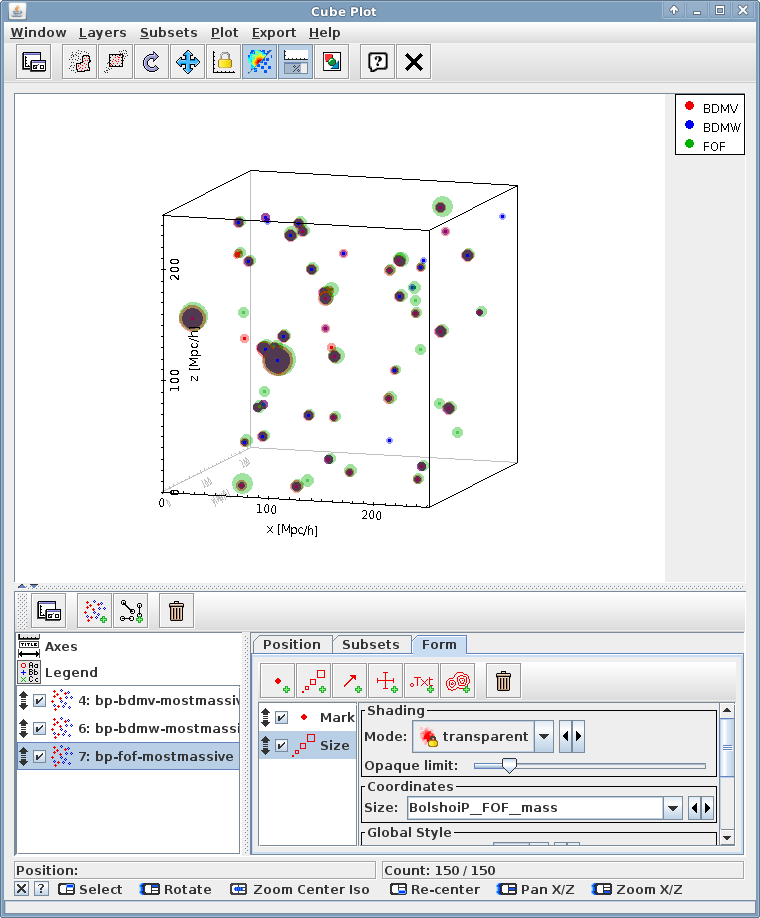
The 50 most massive halos at redshift 0 from the BDMV (red), BDMW (blue) and FOF (green) catalogue